Discussion: Conversion to ISOM2017
in: TheInvisibleLog; TheInvisibleLog > 2017-05-09
May 10, 2017 5:22 AM
#
How did you accomplish the conversion? I can envisage a fair degree of flexibility for hand-placing broken ground and rocky ground dots, as you do now.
May 10, 2017 6:32 AM
#
What are the specific issues that are causing the conversion to fail?
May 10, 2017 7:12 AM
#
I just did a straight conversion using a CRT table I generated myself. The OCAD supplied CRT had different numbers to the one I use in OCAD10. I don't fully understand the difference. Part of it is point symbols. In Oz all our mappers have used smaller than specified point symbols (pit and depression being obvious) when mapping gold mining. We got away with it in part because required minimum distances were less and there was not much attention on these issues. I have made a straight conversion of a partially mapped gold mining area. It looks awful with a straight symbol conversion to ISOM2017 at 1:15k. It looks like the old map at ISOM2017 @ 1:10k. I have decided to continue mapping the area at 1:10k rather than 1:15k as an experiment. I cannot see the area being chosen for a WRE. . I am not sure about the dot area symbols. OCAD doesn't have a single dot symbol as far as I can see, but reading the spec I can't see why one wouldn't be able to use individual dots.
As I am a somewhat inexperienced mapper, I would like to see someone have a go at the conversion of some more detailed gold mining. Commision someone like Alex do the following to a small part of a map like Petticoat Gully.
1. Straight conversion to ISOM 2017 at 15k
2. Straight conversion to ISOM 2017 but at 10k.
3. Remap area using ISOM 2017 with sufficient generalisation to make legible.
4. Make recommendations on a set of adjustments to ISOM 2017 to allow mapping of the area whilst allowing us to retain the level of generalisation in the original version of the map. For years we had a similar document for granite orienteering.
The different forms of the map would be very educational for all of us.
May 10, 2017 8:54 AM
#
I was talking to Alex about ISOM201X and he was making that exact point about the introduction of an area symbol for rock detail and broken ground rather than the old point symbols. So I would assume that was in the Australian submission and the IOF MC ignored it.
May 10, 2017 11:16 AM
#
While I thoroughly agree that there are interesting and attractive terrains which cannot be legibly mapped with ISOM2017, you are constraining yourself un-necessarily.
It seems (correct me if I am wrong) that you might be treating a symbol set supplied by Mr OCAD as gospel. It is merely something that an interested software provider has assembled to perhaps make it easy for users.
The gospel according to Saint IOF, is the specification document. The area symbols provided by Mr OCAD for broken and stony ground are only one way to meet the specification. Another way might be to make a single dot symbol, and to place them yourself. As I understand the gurus of Australian mapping like to do. If you satisfy the requirements for density and spacing, how can anyone allege that they do not meet the specification for random dots? In fact, do you think anyone is going to be measuring your dots?
There will be, always was, a fair bit of scope for cartographic creativity in our mapping.
PS I can't (at the moment) think of a creative way to handle symbols that have grown larger. If, visually, the experts feel that a symbol needs to be larger, I'm very receptive. And it will only be a problem in feature-rich terrain. And many mappers agree on what we need for feature-rich terrain:-))
May 10, 2017 1:48 PM
#
In the previous spec Australian mappers generally made a number of point features smaller to allow the mapping of mining terrain. This reduces legibility. A better approach would be to map at 1:10k and keep the same sized symbols. That would make a more legible map. But that is not allowed in defence of generalisation.
@Gruver... the individual dot symbols have already been added to my symbol set. I am using OCAD 10 and it is incapable of making random dot patterns. So you have to amend the symbol set to remain consistent with the spec. Ironic.
@Gruver... the individual dot symbols have already been added to my symbol set. I am using OCAD 10 and it is incapable of making random dot patterns. So you have to amend the symbol set to remain consistent with the spec. Ironic.
May 11, 2017 12:18 AM
#
I don't find it ironic to question, vary, and add to the OCAD-provided symbols. One doesn't even have to use OCAD.
BTW I have OCAD 12 which now provides an ISOM2017 symbol set, and the broken/stony ground area symbols do not look very random to me, really just a slightly bumpy pattern EW and NS, with the diagonals still looking remarkably straight, heh heh.
BTW I have OCAD 12 which now provides an ISOM2017 symbol set, and the broken/stony ground area symbols do not look very random to me, really just a slightly bumpy pattern EW and NS, with the diagonals still looking remarkably straight, heh heh.
May 11, 2017 10:12 PM
#
If you really want to you can make what appear to be random patterns easily enough in 10. Make a new area, choose structure, make width and height say 3mm, scatter some dots around randomly until you get the effect you want. Effectively it is a repeating pattern (but the base pattern is random). If you play around with it a bit you can get it to look truly random easily enough. I think this what is meant by 'stochastic' patterns.
An early draft of ISOM 201x had only area symbols and no individual dots but in the final version, as mentioned above, it is perfectly OK to use single dots placed by the drawer. So maybe they did listen in this particular case. The fact that there is no individual dot in the OCAD symbol set means nothing - the OCAD symbol set is not an official ISOM 'document' - it's just someone's interpretation of ISOM
An early draft of ISOM 201x had only area symbols and no individual dots but in the final version, as mentioned above, it is perfectly OK to use single dots placed by the drawer. So maybe they did listen in this particular case. The fact that there is no individual dot in the OCAD symbol set means nothing - the OCAD symbol set is not an official ISOM 'document' - it's just someone's interpretation of ISOM
May 11, 2017 10:29 PM
#
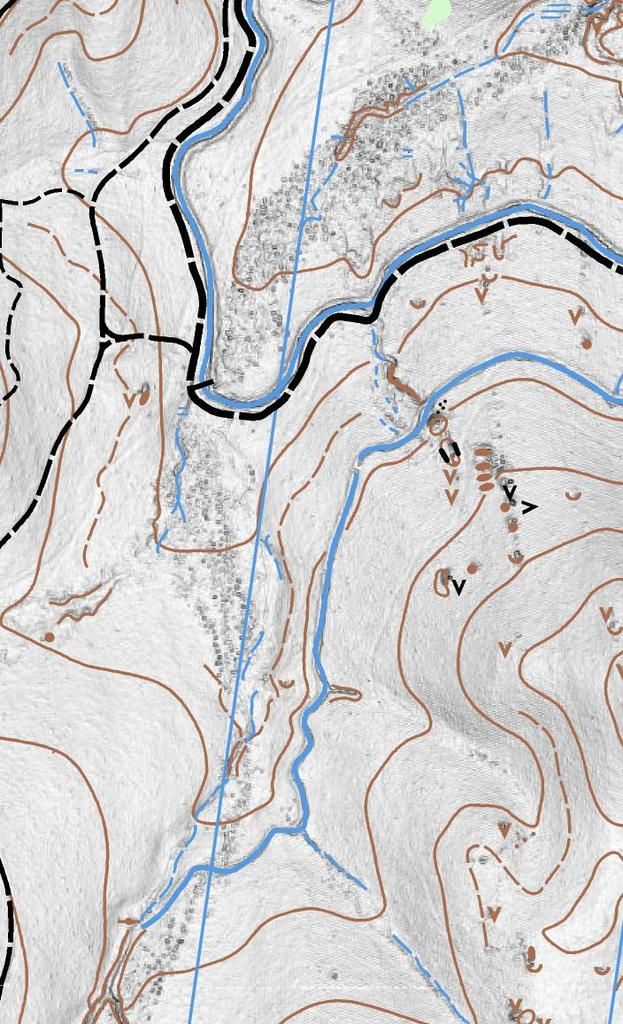
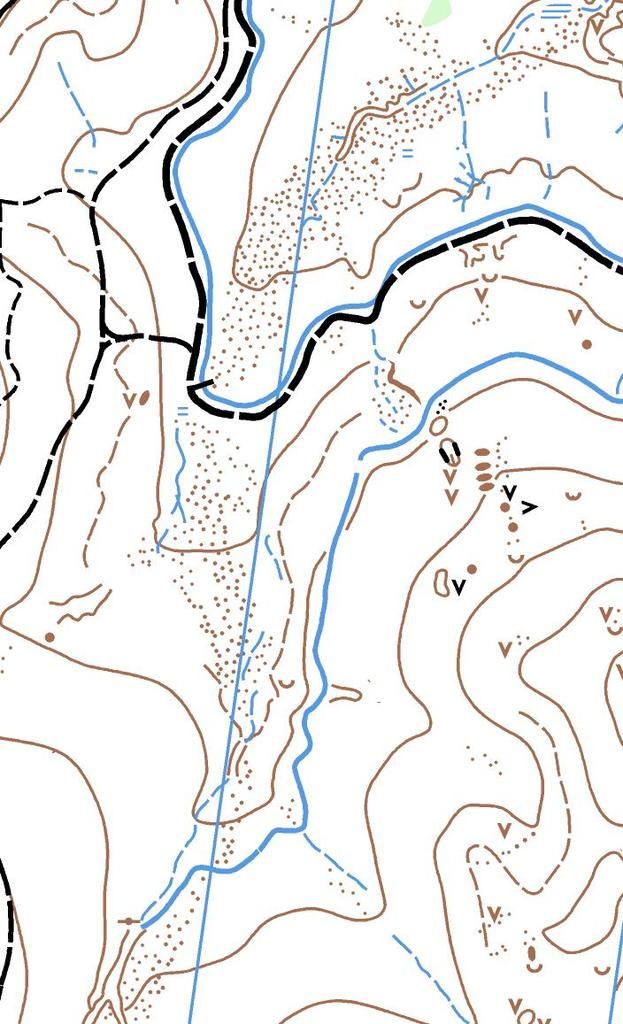
One of the amusing discussions once held over dots and generalisation. The lidar image on the clearly shows the large pits in this broken ground gully. When I say large, I mean that if in isolation each would be mapped. Most were between 1.5 and 2m deep. The map image shows the mapping with larger dots in the place of each large pit and smaller dots in between. So is this a random dot pattern? One interpretation is that it is not random and it does not generalise the broken ground. The other is that the pits are randomly scattered within the broken ground so any accurate representation of their location will also represent that randomness. I chose the accurate placement because it took less thought in the drafting stage.


This discussion thread is closed.