Training Log Archive: Ari-oIn the 31 days ending Jan 31, 2021:
| ||||||||||||||||||||||||||||||||||||||||||||||||||||||||||||||||||||||||||||||||||||||||||||
| « | » |
| » now | ||||||||||||||||||||||||||||||||||||||||||||||||||||||
| Fr | Sa | Su | Mo | Tu | We | Th | Fr | Sa | Su | Mo | Tu | We | Th | Fr | Sa | Su | Mo | Tu | We | Th | Fr | Sa | Su | Mo | Tu | We | Th | Fr | Sa | Su | |||||||||||||||||||||||||||
Sunday Jan 31, 2021 #
Ski 2:42:46 [1] 16.9 mi (9:38 / mi) +615m 8:39 / mi
ahr:99 max:188
Then I skied out and around one of the far fields, then down and up the Bumpus Trail which reminded me of skiing down a chute on a narrow trail and then up a narrow trail, and then around and in. Warmer now, more people.
Ski 1:16:25 [1] 8.37 mi (9:08 / mi) +329m 8:08 / mi
ahr:121 max:159
But with some kick, the skiing was great. I stayed mostly on the backcountry trails and the narrow groomed trails. They're fun! Most could probably have a groomer pulled and be ski-o trails, but not that much of a network. Not that that should keep us from it.
At one point on a narrow groomer, I was going up a hill, and passing two shufflers who were in the track. Coming down the hill was a skier at a high rate of speed. I saw her, and stepped off to the left, into the ungroomed. She thanked me, and the shufflers thought they were being thanked and gave a very sincere "you're welcome."
Over Judges, which was good fun, then back around on some narrow trails, back over Judges (also fun) and back. Lots more people out to slalom, though. Parking lot was full.
Ski 1:10:46 [1] 8.9 mi (7:57 / mi) +433m 6:55 / mi
ahr:165 max:205
Home via Dublin only adds about 20 miles and an hour, and the fastest (although not the most direct) route goes by the best falafel this side of Jerusalem.
Since it was in Vermont, I had to go incognito. I put on a false disguise, and fake green plates on my Prius (the car checks out, at least, although I should have disguised it as a Subaru). Lots of other red and white plates on the road. I evaded border patrol to make the pickup, and after the handout shot out of Brattleboro at 100 mph, with several Super Troopers in tow. But at the new bridge on Route 9, I screeched around the corner and onto the bridge just as they got out of their cars. They tried to shoot out my tires, but I evaded the shots and escaped into New Hampshire unscathed. Live free or die!
(Really, though, I wore two masks and had a recent negative test. You're welcome, Vermonters.)
Dublin was nice, and I got there just as everyone was leaving. It's light until after 5 now!
Saturday Jan 30, 2021 #
Ski 1:42:48 [1] 8.48 mi (12:07 / mi) +321m 10:51 / mi
ahr:86 max:188
The plan was to go out to Notchview, ski, stay in NoHo, then go skin Berkshire East Sunday morning, Mel then back to Boston for science, and I'd go to Dublin on the way home. So two cars were taken.
Out the Pike I get a call that she'd forgotten her AT boots. It was actually not me who did this!
So, it was Notchview. We went striding, her on her old fishscales which are very slow, me on perfect blue wax, so there was lots of out-and-backing ("golden retrievering") and some extra loops. Plus, the fishscales don't do so hot on cold powder, so she was struggling with kick.
"Aha, I said, I have wax!" This was the right solution, except I put it on too much of her kick zone, so she had too much kick (I don't think those skis have any camber, and we should buy her skin skis). So she could run up the hills, but not so much down them.
This was a moderate failure.
Ski 33:38 [2] 4.66 mi (7:13 / mi) +188m 6:25 / mi
ahr:83 max:160
Thursday Jan 28, 2021 #
Ski 1:54:15 [1] 14.72 mi (7:46 / mi) +606m 6:53 / mi
ahr:132 max:196
Wednesday Jan 27, 2021 #
Run 31:21 [1] 3.61 mi (8:41 / mi) +59m 8:16 / mi
ahr:148 max:187
Tuesday Jan 26, 2021 #
Run 30:21 [1] 3.45 mi (8:48 / mi) +27m 8:35 / mi
ahr:146 max:194
AP is having trouble with activity types, thinking this was a trail run. Then some very confused GPS, but mostly on the way out, before I ran through the Harvard station.
Ski 22:27 [1] 3.32 mi (6:46 / mi) +36m 6:33 / mi
ahr:92 max:156
Ski 21:50 [4] 4.0 mi (5:28 / mi) +45m 5:16 / mi
ahr:65 max:74
Probably not quite enough snow to groom the rest of the course, or Great Brook. But a start. And should be great for Green's/Dublin/Notchview/Thunderbolt.
Ski 24:47 [1] 3.26 mi (7:36 / mi) +36m 7:21 / mi
Monday Jan 25, 2021 #
Run 30:38 [1] 3.75 mi (8:10 / mi) +127m 7:24 / mi
ahr:172 max:205
So I was running down the pier by the sidewalk catching up on and slowly passing another runner, probably about 1 min/mi pace faster. I give him clear berth to the side but as I pass, he accelerates, matching my pace. Which is annoying, obviously. So I dial up the pace, just a little, and he matches that, then drops off, and says "you're not supposed to pass grandpa."
At this point I was pretty mad, and just went into a dead sprint for about 100m to get away from him.
A few comments:
1. I guess he was trying to be funny. It's one thing to get passed by someone and say what he did. It's another to do the "try to keep up" annoying thing and then say it.
2. When people are basically dressed in a burqa, how do I know how old they are?
3. Oh, also, PANDEMIC. So maybe don't run right next to me, guy?
Usually, the people who try to keep up with someone passing them are young, not-that-in-shape men getting passed by women. Melissa and I used to do this to guys along the Esplanade (she'd run past someone, they'd try to keep up, she'd accelerate and drop him, it was hilarious). But this seemed completely unnecessary.
I hope when I am an M6 or whatever I'm not that much of a dink.
Sunday Jan 24, 2021 #
Ski 2:11:07 [1] 16.78 mi (7:49 / mi) +625m 7:00 / mi
ahr:87 max:143
Ski 44:52 [1] 6.64 mi (6:45 / mi) +239m 6:05 / mi
ahr:89 max:116
Saturday Jan 23, 2021 #
Ski 3:33:31 [1] 30.09 mi (7:06 / mi) +917m 6:29 / mi
ahr:121 max:204
Wednesday Jan 20, 2021 #
Run 40:42 [1] 4.81 mi (8:28 / mi) +45m 8:13 / mi
ahr:158 max:199
Tuesday Jan 19, 2021 #
Ski 20:26 [1] 2.93 mi (6:58 / mi) +21m 6:49 / mi
ahr:103 max:133
Ski 13:11 [4] 2.83 mi (4:40 / mi) +40m 4:28 / mi
ahr:132 max:163
Started with the mask bunched up on my nose so I could pull it down as the race went on. Gasping at the end.
Ski 15:28 [1] 2.32 mi (6:40 / mi) +32m 6:24 / mi
ahr:116 max:150
Monday Jan 18, 2021 #
Ski 2:00:17 [1] 15.19 mi (7:55 / mi) +623m 7:01 / mi
ahr:123 max:175
Sunday Jan 17, 2021 #
Ski 1:15:26 [1] 9.29 mi (8:07 / mi) +350m 7:16 / mi
ahr:99 max:147
Trails are interesting. The skating trails are relatively benign, on old roads, but the classic trails are quite fun through the woods. At 3000 acres, the trails are quite sparsely laid out, so it seems like there are more trails than there are. I skied most, DPing some classic trails, and generally enjoying myself, although we agreed the skating was hard, less because it was soft and more the variable conditions.
Ski 2:21:24 [1] 13.48 mi (10:29 / mi) +539m 9:20 / mi
ahr:70 max:124
I skied down to the store, then back up and around the perimeter loop. Which would have been real fun with more snow, and was real adventure skiing: glad I was confident in my snowplow. Then did another race course loop and then went and got a cookie and sandwich.
Saturday Jan 16, 2021 #
Run 35:29 [1] 4.36 mi (8:08 / mi) +30m 7:58 / mi
ahr:112 max:132
Friday Jan 15, 2021 #
Run 37:24 [1] 4.44 mi (8:25 / mi) +27m 8:16 / mi
ahr:159 max:195
Run 13:17 [3] 2.0 mi (6:38 / mi)
Wednesday Jan 13, 2021 #
Trail Run 25:47 [1] 2.28 mi (11:19 / mi) +53m 10:33 / mi
ahr:169 max:198
God I hate that 128 tore through the middle of the Blue Hills and Fells.
Orienteering 1:14:37 [1] 5.69 mi (13:07 / mi) +228m 11:40 / mi
ahr:147 max:195 11c
With no one to follow, I ran to 1 pretty well, and then found 2 as well using terrain and features. 3 was an obvious hill and 4 was basically "here's a rock, there's a cliff, so, probably?" 5 looks like a dot hill on the map but is actually a rock pile, glad I checked the clue sheet ("It's not a clue sheet! It's a control description!") I made a slight parallel error to 6 but corrected pretty quickly, and 7 was a bit of an adventure. Great running along a stream, which I then left to climb it's bank. Only problem: unmapped greenbriar thicket at the top, right on the line. I bashed through that, sort of, and got to 7. For 8, I left the trail too soon and was high on the bench and up in the oak slash, but corrected down to it, and then found a nice runnable-ish path down the hill to the trail, 9 was easy, and then 10, which was impossible to find in 2019 (vegetation mapping is off, and the dot hill is unclear) so I went to where it probably is (no control), said beep, and ran to 11 at a trail junction. Maybe should have attacked from the south. It's the kind of thing where if you are going to put a control there, at least make the map correct (the depression you should be able to use from the north to attack is mapped as white and has visibility of maybe 15 feet).
Times (2019, 2021)
2:48—3:08
6:27—7:35
12:11—10:14
16:34—13:08
24:33—19:37
31:54—26:23
40:42—35:01
49:42—42:50
61:03—55:11
69:51—64:07
72:11—65:58
So, I lost about 5 minutes over the first five or six controls, where I was doing some following in '19, and was then pretty close, making fewer mistakes and choosing better routes. Greenbriar to 7 probably cost me some time, and I'd chalk a bit up to "being in the circle where I'd usually see a control and having to check the map to make sure."
Anyway, it's not skiing, but it's good O weather. Maybe Friday? Then pray for snow.
Tuesday Jan 12, 2021 #
Ski 27:29 [1] 4.4 mi (6:15 / mi) +62m 5:59 / mi
ahr:135 max:168
Weston is in pretty good shape, considering it hasn't been below 24˚ since Christmas (since Dec 19!). Quite the stretch, actually: the 15 days of the month in which it will stay between 24 and 42 will be the fourth-longest such stretch ever in Boston, and the only one in January (usually there is 40˚ of temperature differential during that time, yes I found these data).
Anyway, the loop is now exactly 1 km, so I took a bunch of spins around, and went to pee by the river behind Mount Weston. Nice Weston grooming, icy sections, boilerplate sections, newer manmade sections, groomer, ruts, etc. Just what I expect! The pinny system works very well; it's easy to glance behind you for racers. A lot more room helps, too.
Ski 15:00 [4] 3.1 mi (4:50 / mi) +43m 4:38 / mi
ahr:91 max:140
Now it's a time trial, go hard, then go harder. Which I did, laying down the hammer on the last lap, getting that sort of blurry vision thing, and definitely tasting some lactic acid after the finish. Almost caught the guy in front of me. No results yet, but I ran the 5k course in 15 minutes, and it was always a risk to take the rutted-but-icy track and risk falling or the slower newer snow track. I didn't fall, but I almost did!
Ski 21:04 [1] 3.1 mi (6:48 / mi) +43m 6:31 / mi
Monday Jan 11, 2021 #
Note
Weekly plan:
Tuesday: INTERVAL WORLD CHAMPIONSHIPS
Wednesday: Morning 2019 Traverse rerun
Thursday: Dublin or Gunstock (TBD)
Friday: ??
Weekend: Skiing somewhere, weather-dependent.
Not moving and packing means a lot more time to do fun things.
Bicycle 25:35 [1] 6.79 mi (3:46 / mi) +54m 3:41 / mi
ahr:96 max:138
Run 1:08:53 [1] 7.99 mi (8:37 / mi) +44m 8:29 / mi
ahr:181 max:198
Sunday Jan 10, 2021 #
Orienteering 2:10:28 [1] 8.33 mi (15:40 / mi) +299m 14:05 / mi
ahr:143 max:203
Melanie wanted to try orienteering (verdict: likes the trail parts more than the woods parts, seems pretty good at navigating, should go find somewhere with nice open not-rocky woods and fewer trails to run). After a couple of ideas, I said we should run the 2015 traverse course 6->1, but we were cold, so we ran to the triangle and then ran back. We found the controls; mostly I let her plan the route and I helped on the circle and with the compass. It was the long-leg-split-apart-the-field portion of the race, so lots of trails, and she avoided some good route choices because "I don't want to run through that" which I can understand.
Also her knee feels good. Beautiful day in the woods! At some point this week I am going to head down there at sunrise and rerun 2019. Perfect O weather. Too bad not ski weather.
Saturday Jan 9, 2021 #
Note
Also, if anyone wants a Franconia Notch poster I'm running a special: $5 shipping and it's yours. Venmo me the money and I'll get it out. Or if you're local: next to the recycling bins at 8 Lawrence St until Thursday.
Friday Jan 8, 2021 #
Run 37:09 [1] 4.55 mi (8:10 / mi) +87m 7:42 / mi
ahr:157 max:204
Wednesday Jan 6, 2021 #
Run 31:42 [1] 3.84 mi (8:15 / mi) +33m 8:02 / mi
ahr:147 max:191
Tuesday Jan 5, 2021 #
Ski 25:18 [1] 3.78 mi (6:42 / mi) +98m 6:12 / mi
ahr:56 max:109
They were slow. But then I changed to the hard track Salomons. They were fast!
Attackpoint not finding any climb tonight?
Ski 5:37 [3] 1.2 mi (4:41 / mi) +35m 4:18 / mi
ahr:63 max:71
Ski 23:46 [1] 3.65 mi (6:31 / mi) +91m 6:03 / mi
ahr:104 max:143
Sunday Jan 3, 2021 #
Trail Run 57:17 [1] 6.09 mi (9:24 / mi) +235m 8:24 / mi
ahr:140 max:192
I kind of drew a Strava art fish.
Saturday Jan 2, 2021 #
Note
It comes that time where I can look back at a non-arbitrary period of time (one year) on an arbitrary date (in the middle of ski season) and, uh, see what happened.
It is also, as pointed out recently, a time when I have reached 10 years of tracking all of my training miles (if not hours) as well as non-training miles, and see what happened there, too. And to post some images somewhere so that I can source them in a (long) Attackpoint thread.
So, here it is.
2020 began like most other years. There was snow and skiing, then it was 70, then there was more snow, some races, some short runs between calls and meetings; a normal year. I was keeping my running miles decently up, getting ready for a race in April, and the Birkie happened and it was beyond glorious (all of the post-race podcasts are up now if you want to be transported to a time when people were coughing in crowded bars and we should have known better). I even bought the fancy new Nike shoes for Boston. They are still in the box.
Then March happened. March 10 was D-Day, I ran 16 miles on a Tuesday morning, New Bedford was canceled that afternoon, and a week later I was flying, sight-unseen, to California, for three months. Where I ran a lot, attempted to surf, and didn't get covid. Then back to New England, Maine mostly, for the summer, running and mountains and some rollerskiing, still didn't get covid, and then back to/towards Boston for some skiing this winter. Not a lot of intensity, but a lot of hours. It turned out that my training wound up being pretty good 100 mile training, so I did that, pretty successfully.
Some statistics:
Races: Jan: 7. Feb: 6. Mar: 2. Rest of year: 1.
Hours by month (* highest of any month):
39, 32*, 37, 40*, 35*, 48, 50*, 49, 47, 60*, 46*, 50*
I guess now it's chart time, isn't it!
Here are hours:

Previous years have mostly been parallel, despite different life experiences (work, grad school, etc). 2016 lagged for a while because I lost two weeks of training, but otherwise they were well-clustered and seemed to converge at the end. 2020 followed suit at first, but then accelerated in mid-March, and especially starting in June. Pretty easy to find the 100 miler, and other big days (two Pemis, a Presi, and 36 for 36). And also the "all the snow melted and I'm sitting at 532 hours" in the last week of December. A normal trip to MSA would have had me close to 550!
Hours per day (28 day average)

There's some rhythm to my hours per day training, with relatively high numbers during ski season, lower during mud season/marathon tapering, averaging around an hour per day except some summers where I take training trips. Notable low in 2016 when I had half a month of zero, and 2019 spring, when grad school hit. Relatively low numbers training for road races, since the miles don't require as many hours and, uh, I don't do enough cross training (rollerskiing in the fall). 2020 differs in that I was at 2h/day for the second half of the year.
I can do the same thing with total meters ascended

In 2018, I made a concerted push for 100km, and made it during the final days at MSA. I got ahead of the line in 2020, but like most years fell off during the spring, which is a combination of marathon training and wet trails. I've generally been quite clustered for the first half of the year, in fact, although big trail running trips stand out: 2019 in the Alps, 2016 and 2017 in Colorado, and it's pretty easy to find big days in the Whites. 2020's slope never got steep over a long period of time, but I just found more time in the mountains.

This is even more apparent over a four-week period (I've added in the logged part of 2013 here). 2019 in Cham stands out, as many mountains were run up. Then is 2013 at Lakes. In fact, most of 2020 wasn't the highest period on record, but from June to November I stayed at 400m per day (or so), more than the 273 I needed to average. I had an extra day, too, although I crossed 100km with a month to spare.
Some notable low periods: Marathon tapers, Summer in Chicago (2016 and 2017 especially). It's flat there.
In 2018, I tracked how many m I'd need, per day, to reach 100km. After a flat summer, I had to average well more than the mean, but made it. In 2019, I was near the mean, but marathon training slowed it down. No such problem in 2020! I was in the vicinity of 2019 until September, but mountains in the fall made quick work of that.
So that's the training log overall. But what about specific activities? What about non-training travel? I'll move over to my 10-year Google Doc for that one! A little background: after a kind-of-crazy trip to ski the Double Birkie while TSAstatus (RIP) was going viral, I decided I should keep track of my miles, by day and by mode. That was 10 years ago, and I've been entering mileage, rounded to the nearest half mile, since. The 2011 data is a bit janky as my methodology has changed (mostly as to what counts as transport versus exercise/pleasure; most anything in the log is in the latter category) but it's mostly been the same since. And yes, SGB does something similar.
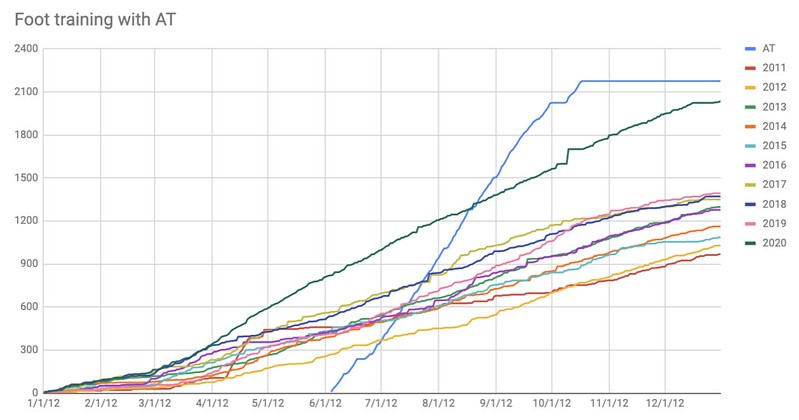
So let's get started with something easy: running miles! Well, foot training, so running, O, hiking, trail running, etc.

Before this year, I'd never (*, which I'll address momentarily) run more than 1400 miles in a year. This year, I had covered 1400 miles by September 1. I hewed close to previous years until April 1, but then instead of tapering for a marathon, I just kept going. By June, 2000 seemed reasonable, and by September I was tracking how many miles per day I'd need to hit 2000. Which I eventually attained. One note: by my online tracker, rounding to the nearest 0.5, I got 2029.5, and by Attackpoint, I got 2039.5. Close enough.

This is even easier to see on the 30 day moving average. During March, I paralleled other Boston training years quite well, but instead of going into a taper, I just kept going. I peaked at almost 9 miles per day in April, kept above any previous year until August, and then had another, even higher peak in the fall. Gee I wonder why.
About that *: This is not the greatest number of miles run in any year for me! I have data from 2006, when I hiked the Appalachian Trail. So I can overlay that, too. Even with just trail miles, I was at 2200, and averaged 18 miles per day most of that.
We don't have to stop with running. How about skiing? It's worth adding skiing and rollerskiing together, right? And not breaking the season in January, but rather the ceremonial beginning of the season, May 1. This year, I got ahead of the game rollerskiing in the summer, but slacked off in the fall. I don't expect a big winter mile season, what with poor snow so far, no MSA, and Weston restrictions. But we'll see.

What about days off? I keep track of those too. Well, I keep track of days with zero miles, so I can keep track of rest days #restdaybrags:

Only once before 2020, in 2013, did I go a month without a rest day. In 2020 I had a two-month run streak, and another month-long training streak in July. Somehow, I came away uninjured. Biggest #restdaybrags? Post 2016 marathon, 2015 December when I sprained my ankle, and 2019 when I was writing a thesis.
Now, how about non-training transportation? I have that, too! Here's walking:


You can see the refined methodology over time. In 2011, I defined hiking in and out of the huts (Aug-Oct) as transportation; in 2013, it was defined as exercise (loggable) so instead of particularly high it was quite low. I'm not about to go back and recategorize things; it would be a lot of guesswork. Not only did I not have a log, I didn't even have a Strava! I was entering distances based on the White Mountain Guide.
It's interesting how seemingly unlike years cluster. 2014, 2015, 2018 and 2020 were all different life situations, with similar amounts of walking for transport. 2019 was quite high, and 2020 was shaping up to parallel 2019 until covid. Getting a bike in San Diego and living in Maine did not make for a lot of walking for transport.
Now, biking (note: I don't do enough bike training for fun charts).


Like walking, the 2020 lifestyle did not lend itself to a lot of biking. Why were 2015 and 2016 high? My commute got longer, and I made it most days by bike. (Still not very long!) The grad school years were shorter. We'll see how 2021 shapes up. Still, I would guess there were years in the Twin Cities when I biked a good deal more than this with a longer bike commute and at least one month I cracked 300 miles for work trips alone.
Motorized transport? Yes, we have that too. Let's start with all transit use, and then breaking it down by bus and train:


Here there's a bit of a split. Some years most of the travel comes from a few trips. Other years, it comes from commuting, especially summers in Chicago when I had a longer, mostly transit commute.
How about driving and riding in cars? Got that, too, and split by driving alone (SOV) or with someone else (HOV). I think SGB keeps track of how many people were in the vehicle! Pretty much anything which was a 15-passenger van or less was a car, and anything bigger would be in transit. School buses for races are still transit, by this count.

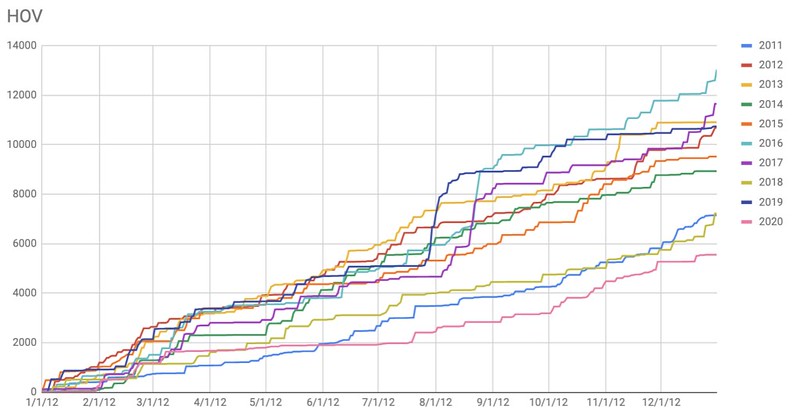

Driving and HOV include several long road trips, in 2016, 2017 and 2019; it's easy to pick those out. I haven't done a 1000-mile solo road trip though, so SOV has more seasonal rhythm to it and has a four-week chart, note how driving is high in winter (ski season), low during mud season, high during summer and fall, low during stick season, and high again when ski season rolls around.

Other notes: 2013 I had a job which required a lot of driving. It's also easy to pick out flat periods: time in the huts in 2013, summers in Chicago (2016 to 2018), 2019 in Europe, and 2020 in covid. 2020 was way behind until I came back to the East Coast.
What have we left out? Air travel!
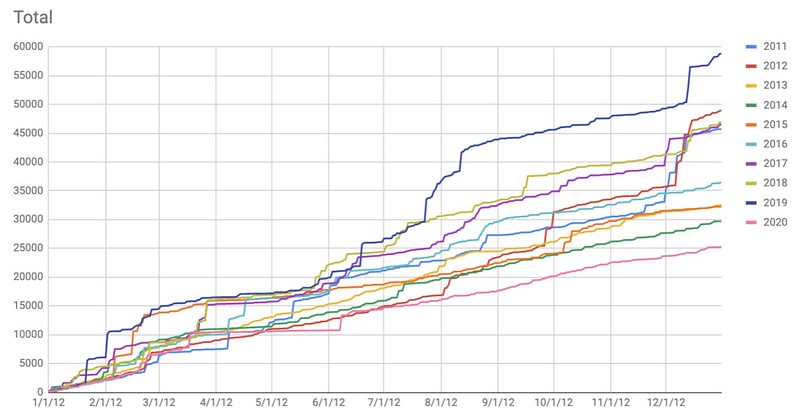
My highest year driving was 2013, the only year over 20,000 miles. But my highest travel year? Good ol' 2019, at nearly 60,000! To the skies we go! This includes all travel but air trips are pretty easy to pick out. Two patterns stand out. Late February has the Birkie trips. Non-status years stand out: 2013 to 2016. And I am master of the last-minute mileage run! Whether it was SFO and PHX on DL in 2011, ANC on DL in 2012, or the last three years of ski-trip-mileage-runs (BZN, DEN, RNO on UA), I've taken to the skies in early December to find some snow, and some miles. But not so much in 2020. The higher y-axis here flattens out time in SAN quite a bit, and without any need (but certainly with desire) to get on an aircraft, 2020 winds up as the lowest year in quite some time.
Hopefully I'll be able to take to the skies, safely, in 2021.
Run 27:58 [1] 3.29 mi (8:30 / mi) +14m 8:23 / mi
ahr:170 max:200
Friday Jan 1, 2021 #
Trail Run 54:55 [1] 5.26 mi (10:26 / mi) +144m 9:37 / mi
ahr:175 max:207